On this page, I’m gathering together images from around the world that show how Global Climate Change is occurring right Before Our Eyes.
Every image you see on this page has been linked by scientists directly to human-caused global warming.
Quick Links to Page Contents
Disappearing Arctic sea ice (1984-2016)
The melting Greenland ice sheet
Glacier National Park, Montana (1850-present)
Shishmaref: A canary in our coal mine
A defiant tree in Fiji
The sandbag walls of Kiribati
The sunny day floods of Miami
The Larsen B ice shelf collapse (2002)
The Larsen C ice shelf
The Great Barrier Reef
A mossy shore
The melting glaciers in time lapse
Collapse! Watch the largest glacier collapse ever caught on film
Okjokull Glacier, R.I.P.
Disappearing Arctic sea ice (1984-2016)

Click the image above to see a <3 minute time lapse video, narrated by cryogenic scientist Dr. Walt Meier of NASA Goddard Space Flight Center, showing dramatic changes in the Arctic sea ice as captured by NASA satellite imagery from 1984 to 2016. Read more.
The melting Greenland ice sheet
On another part of this page, I wrote about what the Miami metro would look like with 6 feet of sea level rise. It’s not an encouraging picture for anyone with interest in high-value coastal real estate.
If the entire Greenland ice sheet were to melt (just Greenland, not including other melting going on in Antarctica and Alaska, for example), it would yield about 23 feet of sea level rise.
Ice sheets in Greenland, Alaska, and Antarctica are melting right now. You might imagine that looks like a dripping faucet. You might imagine it looks like many dripping faucets. You would be wrong.
It looks like this:
That’s a moulin (from a French word meaning, “mill”), a vertical chute through which melt water on the top of a glacier falls through the glacier to its base, lubricating the glacier’s movement at the base and speeding its descent to the sea.
That moulin is on Gilkey Galcier in Alaska. Similar scenes are also occurring on the Greenland ice sheet:
The Greenland ice sheet is dumping about 300 gigatons of ice into the ocean each year, according to NASA, making it the current largest source of sea-level rise from melting ice.
The good news is, this process is expected to take a few hundred years, and we have time to escape much of that fate. The bad news is, it’s a slow-developing disaster. The ice sheets melt at a rate much slower than the rate at which we’re emitting the CO2 that causes their melting. Every single moment, we are committing ourselves to more future melting, and more sea level rise. The time for doubt and denial is over.
Glacier National Park, Montana (1850-present)

Glacier National Park, Montana, established in 1910, was named for the estimated 150 alpine glaciers that covered 21.6 square kilometers in the park around 1850. In 1979, the Earth was an average 0.45 degrees Celsius warmer and the glaciers covered 7.4 square kilometers. By 2010, there were only 25 glaciers left. A recent computer model predicts all glaciers in the park will vanish by 2030. Read more.
What shall we call Glacier National Park, when it contains no glaciers?
Shishmaref: A Canary in Our Coal Mine
On August 16, 2016, the registered voters of Shishmaref, AK voted 89-78 to move their town.
Shishmaref, AK is a town of about 650 people located on an Alaskan barrier island 30 miles south of the Arctic Circle. Archaeological evidence shows people have been living there since at least the 1600’s. Elder residents of Shishmaref recall playing sports on the wide, sandy beaches that surrounded the town in summer:

Lately, not so much.

Since the 1950’s, the town has been rapidly disappearing into the encroaching Arctic Ocean as it faces a “triple threat” of Global Climate Change effects:
- The surrounding sea ice barrier melts earlier in the spring and freezes later in the fall than it used to, leaving the island vulnerable to erosion by violent early winter and spring storms.
- Arctic sea ice decline, averaging about 3% per year, has opened up vast stretches of the Arctic Ocean that used to be frozen, enabling the growth of large waves in the Arctic that batter the coastline.
- The permafrost on which the town is built has been melting, transforming from a hard, rock-like substance into a mushy sand that is easily eroded.
This is not the first time the residents of Shishmaref have voted to move their town; similar votes passed in 1973 and 2002. The earlier efforts involved substantial study but were unsuccessful, not least of all because of the cost. A U.S. Army Corps of Engineers study in 2004 estimated it would cost $179 million to move the town to the Alaska mainland. At about $275,000 per resident, this seems like a reasonable cost if you consider the re-construction of housing for each resident as well as all the public services (schools, medical, utilities, roads, etc.) they currently have. But their requests for state and federal funds for a relocation have, so far, been unsuccessful. Instead, the Army Corps of Engineers helped the residents of Shishmaref build a seawall of boulders, on the shore of their island, to buy them about 15 years to think.
You can read more facts and history about Shishmaref if you want (here, here, here, here, here, and here, for example). Or, you can watch the 5-minute video at the end of this post. Before I lose your attention, I’d like to move on to a couple important questions brought up by Shishmaref. Because Shishmaref is a canary in our coal mine (double meaning intended.) Temperatures in Alaska have increased by 3.4 degrees Fahrenheit over the past 50 years, faster than the rest of the U.S. Over 30 other Alaskan towns face “imminent threat of destruction.” So if you live near a coast, the plight of Shishmaref, and towns like it, is a foreshadowing one.
The questions of adaptability and cost
Many think we can “simply adapt” to Global Climate Change. Shishmaref has a population of 650 and has been seeking funds to relocate since the 1970s. If we consider this tiny town as a test case for adaptability, the results have not been encouraging. With nearly 50 years of effort, the citizens of Shishmaref have managed to attract funding to build a seawall of boulders that everyone recognizes as only a temporary measure. It’s tempting to think these are distant people who have chosen to live in a “stupid place.” This is demonstrably not the case. People have been living in Shishmaref for 500 years, with no problems until around 1950. They are U.S citizens, residents of the state of Alaska. As such, their challenges have been studied by the U.S. Army Corps of Engineers. The result, so far, has been a boulder seawall as a temporary measure.
Now consider, for example, the New Orleans metropolitan area, a population of 1.3 million people living 1-2 feet below the current sea level. What will be the cost of protecting that population from future rising sea levels? Who will pay for it? And what about all the other coastal cities of the U.S.? According to a U.S. Geological Survey report, 50% of the U.S. coast is at a “high” or “very high” risk of impacts due to sea level rise. According to the National Oceanic and Atmospheric Administration, 16.4 million Americans live in the coastal flood plain (this figure is referenced here, although it has disappeared from the NOAA website). Think about this, when you hear any politician talk about the costs of switching to sustainable energy sources. Or, the purported economic advantages (jobs) associated with a new oil pipeline. Which is more expensive? Solar panels now, or seawalls and relocations later?
The question of morality
Shishmaref is emblematic of how we are engaged in a global tragedy of the commons. The folks of Shishmaref have contributed insignificantly to Global Climate Change. The median family income is less than $30,000 and most families there feed themselves based on subsistence hunting, fishing, and berry-picking, as they have for centuries. Gasoline arrives there by barge once a year in the summer, costs upwards of $6 a gallon, and is rationed by the populace when it runs out before the next annual shipment. When was the last time your hometown rationed gasoline? Yet, they are bearing the direct costs of climate change inflicted by the rest of us. Many observers think they will not, ultimately, be successful in relocating their town. Rather, they will simply disperse. They will eat the financial loss of their homes and lose their shared culture developed over centuries of living in that place. Even their departure will be tough; the only way out is by boat or plane, and the flight to Nome costs $400.
And this is how Global Climate Change will initially be paid for, if we don’t stop it. It will be paid for, at the start, by the poorest and most vulnerable people. The people who can’t easily move, or fund seawalls. So when we think about the costs of moving to more sustainable energy sources, we need to understand there are substantial moral considerations. Can we pay a little bit more per mile to drive our cars, for a time? Or should we rather consign other folks to a future of economic oblivion? (and later, our own children and grandchildren?)

A defiant tree in Fiji

Fiji is an island nation in the South Pacific Ocean comprising 332 islands, of which 106 are permanently inhabited by its population of about 900,000 people. They are the descendants of the Lapita people who settled the islands about 5,000 years ago, probably originating in Taiwan or southern China. Expert in seamanship and navigation, the Lapita people and their Polynesian descendants relied on a strong tradition of oral history and small wooden canoes to locate and ultimately settle the Pacific islands from Fiji to Hawaii across hundreds of miles of open ocean. This amazing feat of human exploration has been recently popularized in the movie, Moana.
Can you imagine the courage, faith, and skill it must have taken to set off from one tiny Pacific island to find another, across a hundred miles of open ocean in a small wooden boat, with only the stories of your parents and the stars as your guide? That’s what these folks did, around 5,000 years ago.
In just 3% of that time, since around 1850, the most industrialized among us have begun a process to rapidly deprive those brave folks of their homes, culture, and history. Their beaches are already vanishing due to climate change driven sea-level rise, as exemplified by the lonely tree pictured above. In fact, as discussed at the recent 23rd annual “conference of the parties” (COP) meeting under the UN Framework Convention on Climate Change (UNFCCC) in Bonn, Germany, a joint assessment of the World Bank and the Fijian government determined that Fiji will need to spend an amount equivalent to its entire yearly gross domestic product over the next 10 years to adequately prepare for higher sea levels and stronger storms due to climate change.
So the simple decision on the table is this.
Option A: Turn our backs on the 900,000 current citizens and the 5,000 year human history of Fiji. Blow off the descendants of the people who conducted their own version of the Space Race, before we did ours, by bravely exploring and settling the uncharted expanses of the South Pacific in tiny wooden boats. Enjoy our cheap fossil energy. Why challenge ourselves to do something new (solar, wind, batteries), even though engineers and economists now say those new things can sometimes be as cheap as fossil fuels? Drill, baby, drill!
Option B: Give those brave folks some respect and give ourselves a little bit of a healthy challenge. Revolutionize our relationship with energy and the earth. Replicate the glory of the last generation’s Space Race in that pursuit. We all just may be prouder, happier, and safer.
(After all, what’s been happening in Fiji is also beginning to happen in Houston and Miami. Or haven’t you heard?)

The sandbag walls of Kiribati
Kiribati (pronounced Kiribas) is a Pacific nation comprising 33 atolls and islands and a population of about 110,000. When it gained its independence from the U.K. in 1979, it became the world’s only nation with residents in all four hemispheres. The atolls and islands of Kiribati have had permanent residents since they were settled by sea-going Micronesian explorers in canoes between 3,000 and 5,000 years ago.
The lands of Kiribati rise only 3-6 feet above a sea level that has been relatively stable for the last few thousand years, but less stable recently. The residents are now engaged in an ongoing battle with a rising sea that their president has already conceded they are destined to lose.
High tides flood and salinate farmland. Families erect sandbag walls in an effort to protect their homes.


Kiribati is expected to be largely submerged sometime in the second half of this century, a fate that has already been set by the CO2 emissions of industrialized nations between 1850 and now. It will become the first nation to be destroyed by climate change.
While individual families erect sandbag barriers around their homes, the government of Kiribati is actively planning for its own demise. It has purchased a 5,460-acre estate on Fiji’s second largest island of Vanua Levu, where the government intends to re-settle much of its population in a staged migration. Its schools have integrated into their curricula content intended to prepare young schoolchildren for the move.
(As I have written about, Fiji faces its own challenges from climate change.)
“To plan for the day when you no longer have a country is indeed painful but I think we have to do that.”
The sunny day floods of Miami

I’ve highlighted communities under ongoing assault by the direct effects of global climate change, including Shishmaref, Alaska and the nation of Fiji. And another nation, Kiribati, already doomed to submersion — in many of our lifetimes — beneath the rising Pacific Ocean. Make no mistake; in these cases we are talking about the preventable losses of the homes, livelihoods, and cultures of hundreds of thousands of fellow humans. These losses are happening right Before Our Eyes, by climate change driven processes that are well documented and obvious to anyone who cares to look. Softening permafrost. Shrinking beaches. Increasing storm damage. People suddenly erecting desperate sandbag seawalls around coastal communities that have persisted for thousands of years, until now. That we are continuing to contribute to these losses demonstrates a profound moral failing on the part of those of us who prioritize our continued ready access to cheap fossil energy (even though we have ready renewable alternatives) over the very viability of these distinct human cultures that have developed over thousands of years of people living in these locations.
But, for many readers of this site, Shishmaref, Fiji, and Kiribati may seem like far-flung places. So let’s look at developments that may be closer to home.
You may be familiar with Miami, the 8th most populous metropolitan area in the U.S. and home to roughly 5.5 million people. What if I were to tell you that readily observable, direct consequences of climate change presently affect daily life in Miami, foreshadowing potentially existential challenges for that great U.S. city in the future?
In Miami, as any resident will attest (and as scientists have carefully studied and documented in peer reviewed journal articles), sometimes it floods on sunny days. It doesn’t require a hurricane, a storm, or even a rain cloud. Just a high tide and maybe a full moon. To see what that looks like, check out the photo above, or simply search “sunny day flood Miami” in Google Images. That’s seawater flooding the city streets of Miami on a sunny day at high tide. It happens more and more frequently. Why? Because high tide has been getting higher since the streets of Miami were developed.
“This never used to happen. . . . I’ve owned this place eight years, and now it’s all the time.”
–Eliseo Toussaint, laundromat owner, Miami Beach
Brian McNoldy, an atmospheric scientist and Senior Research Associate at the University of Miami, has been tracking the high tide level at Virginia Key, a Miami barrier island, for two decades:

Clearly, high tides are getting higher. They are also getting higher at a rate that has been increasing over the past 20 years — nearly an inch a year, on average, over the past 5 years! An inch a year may not seem like much, until you consider that would result in a foot every 12 years, or over 6.5 feet in a typical American lifetime, and this is how the great city of Miami (built on porous limestone, so it can’t be protected by a seawall) is presently situated with respect to sea level:

The higher tides have resulted in a measured increase in incidents of “nuisance flooding” in the city (see inset bar chart in the graph above). More than just a “nuisance,” this comes at a real price; Miami Beach plans to spend $400 million over the next 20 years installing pump stations and raising the streets. “There is a lot of money going into these resiliency issues, so we are hoping to tap into that,” said City Manager Jimmy Morales, commenting on the city’s hopes of securing federal and state funds to pay for the improvements.
“Down here, people are actively dealing with climate change without calling it climate change.”
–Tim Osborn, NOAA Manager, Central Gulf Coast
Miami is not the only U.S. coastal city facing chronic tidal flooding due to sea level rise. These are data on sea level rise since 1970, and associated increases in the frequency of tidal flooding events, measured in four other coastal cities:


The President loves to highlight present signs of strength of the U.S. economy. Presidents have been taking credit for good economic performance, when it occurs, since the dawn of our Republic. And, the economy (for many of us) is performing great right now!
There is always a rich debate about whether presidents can rightly take much credit for a good economy. I say, go for it! All presidents claim credit when the economy is good.
But, I think we should think very carefully about claims of causality between deregulation of the fossil fuel industry and economic and job growth, particularly from a president and administration with a history of ignoring and denying climate science.
First, it’s highly debatable that the recent broad economic growth could not have been achieved, or even further enhanced, while investing aggressively in renewable energy sources as science says we need to if we want to avoid the most catastrophic outcomes of climate change. In fact, any suggestion of an obvious direct link between job creation in the fossil fuel industry and performance of the broader economy is demonstrably false. According to the U.S. Energy Information Administration and the Department of Energy, the coal industry employed 160,119 Americans in 2016 while generating 30.4% of U.S. electricity. Meanwhile, the solar industry employed 373,807 Americans while generating only 0.9% of U.S. electricity. If the strategy is about creating jobs, clearly expansion of the solar industry is a far better tactic than creating artificial advantages for a coal industry that is already dying of natural market-driven causes!
And, that tactic also happens to be consistent with what we need to do to prevent substantial economic harms in the long term. Whether Miami will get federal and/or state funding of the $400 million it needs to deal with flooding over the next 20 years remains to be seen, but I think we have recently observed there may be limits to federal spending on climate change driven problems:
Moreover, costs due to climate change driven coastal flooding will intensify greatly in the future; Miami is expected to experience 40 times as many tidal flooding events in 2045 as it did in 2014. The map on the right, below, shows how the Miami metro will look with 6 feet of sea level rise. It is now clear that it will be either technically of economically impossible to protect some areas of hundreds of U.S. coastal cities from climate change driven tidal flooding, and the word “retreat” is now being used in adaptation planning.

We have only recently recovered from the Great Recession, the worst global economic downturn since the Great Depression of the 1930’s, which is widely understood to have been caused by overvalued real estate in the U.S. market. Projecting forward the policies of our current federal government — active suppression of climate change information, defunding of climate science, reneging on international commitments, renewed investment in fossil energy, and the above false claims of causality between U.S. fossil energy investment and broad economic performance — it seems clear that we are building into our long-term economic outlook a slow-moving real estate bubble the likes of which we have never before seen. According to the U.S. Geological Survey, complete melting of the Greenland and Western Antarctic ice sheets would raise sea level by 10 meters, flooding out 25% of the current U.S. population. That’s a lot of high-priced coastal real estate — including the Palm Beach Mar-a-Lago! — that is on track to depreciate to zero value.
In 2018, we should demand more from our elected representatives.
More reading on this topic:
- New York Times article (2016)
- Summary reports by the Union of Concerned Scientists (2017 and 2014)
- Summary report by the National Oceanic & Atmospheric Administration (2014)
The Larsen B ice shelf collapse (2002)

From January 31 to March, 2002, scientists in airplanes, on research ships, and in front of NASA satellite imaging screens watched in amazement as the Antarctic Larsen B Ice Shelf, a 1,255 square mile mass of ice larger than the state of Rhode Island, collapsed completely in a period of just 35 days.

Ice shelves are large sheets of floating ice that form where continental glaciers slowly drain into the ocean. Research published in the journal Nature shows the Larsen B Ice Shelf has been stable for at least 10,000 years, with chunks breaking off at roughly the same rate they were replenished by the draining of the contributing glaciers. (For reference, the earliest human civilizations – Mesopotamia and so on – appeared about 6,000 years ago.) This balance of ice loss and replenishment, which had persisted for at least about twice the entire duration of human civilization, ended abruptly in 2002.
A 2014 paper published in the journal Science reported studies of the Larsen B grounding zone (the zone where the floating ice shelf had been connected to the coastal bedrock) showing it had been stable before the collapse. This indicates the collapse was driven by unusually high surface temperatures, exceeding the highest surface temperatures that have occurred for at least the past 10,000 years. Ponds of melt water formed on the surface of the ice shelf (you can see them in the first satellite image above). Those filled small cracks on the surface of the shelf, and the weight of the water then drove the cracks through the full thickness of the shelf. Read more here.
Like the Arctic in the Northern Hemisphere, Antarctica has undergone a surface temperature rise faster than the global average, about 0.5 degrees Celsius per decade, since at least the late 1940’s. The 2002 event was a dramatic illustration that large, previously stable ice shelves can be highly sensitive to surface temperature changes.
Since ice shelves are already floating on the ocean, the collapse of one does not itself contribute very significantly to sea level rise. However, ice shelves slow down the flow of continental glaciers into the sea, and this ice contributes directly to sea level rise. In fact, a detailed 2004 study of five glaciers previously buttressed by the Larsen B Ice Shelf showed they had sped up by factors between 2 and 8 by the end of 2003, contributing an additional 6.5 cubic miles per year of water to the oceans. Potential sea level rise from a complete melting of this region of Antarctica, the Antarctic Peninsula, is estimated at 0.46 meters. Potential sea level rise from a combined melting of the Greenland and Western Antarctic ice sheets similar to melting that occurred in the distant past would cause a sea level rise of 10 meters, flooding about 25% of the current U.S. population. To read more, see this U.S. Geological Survey fact sheet.
As for the Larsen B Ice Shelf, a 2015 NASA study indicates the surviving portion will disintegrate within a few years (see video below).

The Larsen C ice shelf
On Thursday, June 1, 2017, President Trump was strolling out to the Rose Garden podium, following the U.S. Marine Band’s rendition of “Summertime” (“Summertime” – seriously? – you couldn’t make this stuff up), to explain to us how the U.S. will join the other two global technical superpowers, Nicaragua and Syria, in uniquely having this climate and energy thing all figured out. Meanwhile, this was happening a few thousand miles away:
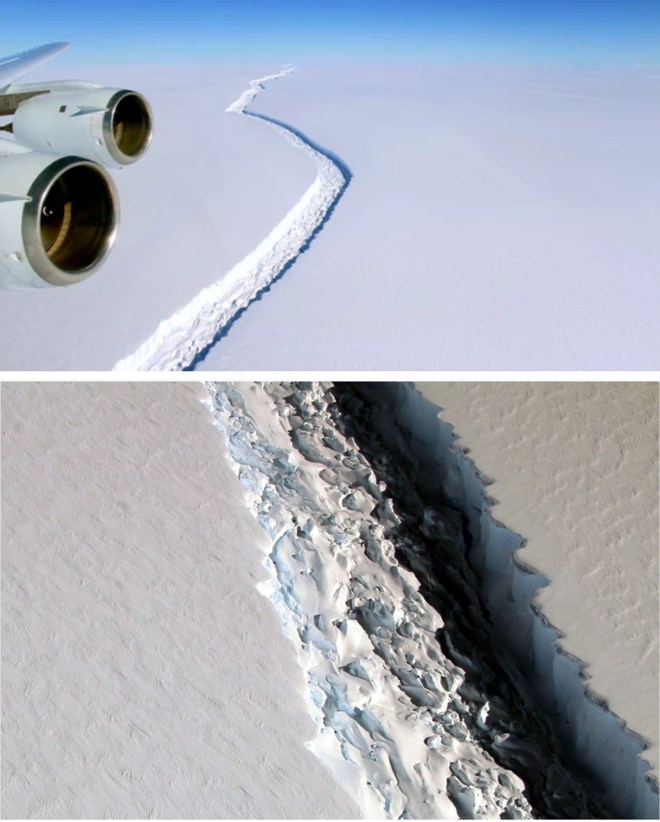
Showing both events on a split screen would’ve made for some good TV.
The photos above, of a crack in the Antarctic Larsen C ice shelf, were taken last November. But throughout last week, scientists watched as the greater than 120-mile long crack advanced 11 miles, leaving the crack tip only 8 miles from the edge of the ice shelf. This chunk of the ice shelf is expected to break off soon, freeing an iceberg roughly the size of the state of Delaware.

The floating ice shelves slow down the draining of land-based glaciers into the ocean, a draining process which directly causes sea-level rise. I posted previously about the 2002 collapse of a large section of the nearby Larsen B ice shelf that had previously been stable for at least 10,000 years. Following the collapse, the land-based glaciers previously buttressed by Larsen B began draining an additional 6.5 cubic miles per year of water into the ocean. 15 years later, those glaciers are still flowing at an accelerated rate.
As I explained in my previous post, these ice shelf collapses in Antarctica are attributed directly to human-caused global warming. They are getting bigger and bigger. Along with thermal expansion of the oceans as they warm, melting polar ice is among the climate change driven processes that are actively destroying coastal communities in Alaska. These processes threaten to flood Manhattan, New Orleans, and Miami if the industrial nations of the world fail to work together to decarbonize our energy sources.
The Great Barrier Reef

A mossy shore

A ruggedly verdant scene. A lonely, mossy, wind-swept shore battered by white caps. Where in the world do you think it is? A craggy coastline of Ireland, perhaps?
Confession time: I (inexpertly) altered the photograph above. Here’s the original one:

Those aren’t white caps. They’re icebergs.
Now, where do you think we are?
The western peninsula of Antarctica. Seem unnatural? If you think so, you’re right. At least, it’s unnatural compared with a similar photo that might have been taken 50 years ago or before that, which would have shown “a monochrome shot of ice.” That’s according to Dominic Hodgson, co-author of a new study of “moss cores” published in the scientific journal Current Biology.
Warming temperatures and dwindling ice, resulting from global climate change, are causing a “greening” of the western peninsula of Antarctica, where the study of a 150-year record of “moss cores” from 3 separate areas of the peninsula shows moss coverage has increased by “4 or 5 times” over the past 50 years. This creates risks of unpredictable ecological changes in Antarctica, for example, due to the growth of invasive plant species that could potentially spread there.
The greening of Antarctica parallels similar findings in the warming Arctic, where it may actually be occurring faster.
Read more: CNN, The Washington Post, Current Biology
The melting glaciers in time lapse
In 2007, photographer James Balog founded the Extreme Ice Survey (EIS), the most comprehensive ground-based photographic study of the Earth’s glaciers ever undertaken. Pioneering new automated time lapse technology, James and a team of scientists, videographers, and extreme weather expedition experts have setup 43 cameras to record the changes occurring in 24 glaciers in Antarctica, Greenland, Iceland, Alaska, Canada, Austria, and the Rocky Mountains. Over the past decade, this has resulted in stunning time lapse recordings of the changing glaciers (spoiler alert, they are melting). Click each of the images below to see, in about a minute, the effects of 7-8 years of climate change on one of the world’s largest glaciers.
Along with expansion of the oceans as they heat up, the melting of the large, land-based glaciers in these videos directly contributes to sea-level rise. A recent scientific study of the melting of Antarctic land-based glaciers, published in the prestigious and extensively peer-reviewed journal, Nature, makes the following conclusion:
“Antarctica has the potential to contribute more than a metre of sea-level rise by 2100 and more than 15 metres by 2500, if emissions continue unabated. In this case atmospheric warming will soon become the dominant driver of ice loss, but prolonged ocean warming will delay its recovery for thousands of years.”
The second of the above sentences refers to modeling results that quantified the expected effects of rising atmospheric temperature on the ocean temperature. The ocean heats up more slowly than the atmosphere. This means that atmospheric temperature changes we are “locking in” now will result in delayed warming of the oceans that will take millennia to reverse, even if we were to arrest the heating of the atmosphere now. This “sluggishness” of many of the Earth’s climate responses, very well understood by scientists, is important information for all of us to understand. As our leaders dither around with ignorant and disingenuous arguments about whether climate change is even happening (it is), balancing needs of the environment against short-term jobs in the fossil fuel industry (or, as evidence suggests is really the case, short-term profits for highly influential fossil fuel executives), we must understand that the decisions we are making right now, every day, are profoundly affecting the challenges of future generations, including the kids among us right now.
As you watch the videos below, imagine our children, and their children, and their children’s children, either erecting sea walls that will grow to 15 meter (49-foot!!) heights or abandoning our favorite coastal cities. Then, balance that against the potential for short-term job losses in the fossil fuel industry (keeping in mind that new jobs would presumably be created by the aggressive development of renewable energy). Destruction of our coastal cities and job losses in the fossil fuel industry are both economic harms, there is no doubt. Which is worse?


Collapse! Watch the largest glacier collapse ever caught on film
Click below to watch a 5-minute video of the largest glacier collapse ever caught on film, according to the 2016 Guiness Book of World Records.
On May 28, 2008, while setting up to capture time-lapse footage of the Ilulissat Glacier (also known as the Jakobshavn Glacier) in western Greenland, documentary filmmakers Adam LeWinter and Jeff Orlowski happened to be in the right place, at the right time, to capture on film a 75-minute calving event during which a chunk of ice roughly the size of Manhattan broke off the glacier and collapsed into the ocean, causing a virtually instantaneous one-mile retreat of this Greenland glacier.
The filmmakers’ footage of glacier changes in the Arctic, due to global warming, was ultimately part of a documentary film, Chasing Ice, which won an Emmy in 2014. (You can stream it on Netflix.)
In 2015, the same glacier lost another 5 square mile chunk of ice during a 2-day period in August. Its current melting rate is roughly three times its melting rate in the 1990’s, according to a scientific study published in 2014. The Greenland ice sheet is dumping about 300 gigatons of ice into the ocean each year, according to NASA, making it the current largest source of sea-level rise from melting ice.
A complete melting of the Greenland ice sheet would raise global sea-level by about 20 feet, with dramatic consequences for coastal communities.

Okjokull Glacier, R.I.P.
On Sunday, August 18, 2019, a group of about 100 scientists, politicians, and others hiked 2 hours up the desolate side of an extinct volcano northeast of Reykjavik, Iceland to commemorate the final demise of the Okjokull glacier, Iceland’s first glacier to be entirely lost due to climate change.

Once spanning an area of 38 square km, according to a 1901 geologic map, the Okjokull glacier had shrunk to 3 square km when aerial photographs were taken in 1978. In 2014, following two decades of warming summers, glaciologist Oddur Sigurdsson, of the Icelandic Meteorological Office, determined Okjokull was no longer a glacier, as it lacked sufficient thickness to move under gravity and was melting faster than snow could be replaced on its cap. At that time, “jokull,” meaning “glacier” in Icelandic, was dropped from its name and it has been called simply “Ok” since. Now, Ok is a smattering of snow and ice covering less than 1 square km.

Children among the group of ice mourners placed a copper memorial plaque at the site of the former glacier. Engraved on the plaque in Icelandic and English is the following remembrance:
A letter to the future
Ok is the first Icelandic glacier to lose its status as a glacier. In the next 200 years, all our glaciers are expected to follow the same path. This monument is to acknowledge that we know what is happening and what needs to be done. Only you know if we did it.
August 2019
415ppm CO2

At the beginning of the same month, the Greenland ice sheet dumped 12.5 billion tons of meltwater into the ocean within just a 24-hour period, the largest single-day loss since ice loss records began in 1950. There is sufficient land ice on Greenland to raise global sea levels by about 25 feet.
“I know my grandchildren will ask me how this day was and why I didn’t do enough.”
Gunnhildur Hallgrimsdottir, 17, at the site of the former Okjokull glacier